dataviz

Contenu

Titre
dataviz
preferred label
dataviz
Complexité
11
Date de modification
6 septembre 2023 à 07:48:35 +00:00
Détails de la complexité
Physique,1,,,,,2,2
Actant,1,,,,,1,1
Concept,1,,,,,3,3
Rapport,1,1,Concept,Concept,properties,2,2
Rapport,1,1,Concept,Physique,values,2,2
Rapport,1,1,Actant,Physique,owner,1,1
Totaux de la complexité
Physique,1,1,1,2,2
Actant,1,1,1,1,1
Concept,1,1,1,3,3
Rapport,3,1,1,5,5
Existence,6,1,1,11,11
6,003
Date de modification
8 janvier 2024 à 10:52:32 +00:00
Détails de la complexité
dimension,niv (sujet),niv objet,sujet,objet,prédicat,nb,c
Physique,1,,,,,2,2
Physique,2,,,,,913,1826
Actant,1,,,,,1,1
Concept,1,,,,,3,3
Concept,2,,,,,585,1170
Rapport,1,1,Actant,Concept,properties,2,2
Rapport,1,1,Actant,Physique,values,2,2
Rapport,1,1,Actant,Physique,owner,1,1
Rapport,2,1,Actant,Physique,skos:semanticRelation,83,166
Rapport,2,2,Actant,Concept,properties,585,1170
Rapport,2,2,Actant,Physique,values,747,1494
Rapport,2,2,Actant,Physique,uri,83,166
Totaux de la complexité
Physique,2,1,2,915,1828
Actant,1,1,1,1,1
Concept,2,1,2,588,1173
Rapport,7,1,2,1503,3001
Existence,12,1,2,3007,6003,

Ressources liées

Contenus avec " is in semantic relation with : dataviz "
Titre Classe
emotionVis | Dashboard Page web
Explained Visually Page web
Framindmap - Outils Dataviz Page web
Frappe: Frameworks + Apps Page web
Geofolio Page web
H2020 Visualization Page web
History of Infographics Page web
How to Create a Google Data Studio Dashboard | Towards Data Science Page web
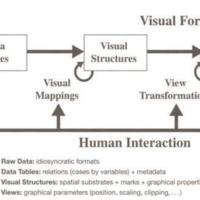
http://infovis.fh-potsdam.de/readings/Card1999.pdf Page web
http://obvil.lip6.fr/cataviz/? Page web
IbrahimTanyalcin/LEXICON: Data visualization library for creating interactive graphs and dashboards for bioinformatics etc. Page web
Interactive presentation software - Mentimeter Page web
Introduction - Cairn.info Page web
L’écosystème numérique de la datavisualisation - Cairn.info Page web
L’expert en dataviz, un métier en transition | Cairn.info Page web
La boite à outils Page web
Le territoire comme un graphe - Cairn.info Page web
Les visualisations de données inspirées par le jeu et la conception par disengamement - Cairn.info Page web
Lower Normandy | OECD Regional Well-Being Page web
Lyra: An Interactive Visualization Design Environment | UW Interactive Data Lab Page web
Macro Connections | MIT Media Lab Page web
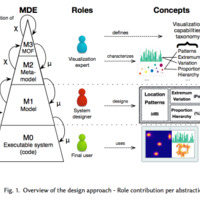
MDE in Support of Visualization Systems Design: a Multi-Staged Approach Tailored for Multiple Roles Page web
Morph Page web
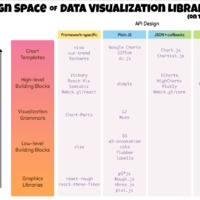
Navigating the Wide World of Data Visualization Libraries | by Krist Wongsuphasawat | Nightingale | Sep, 2020 | Medium | Nightingale Page web
Nodetrix Page web

Annotations

There are no annotations for this resource.